

Municipal asset longevity is the period during which a public asset reliably delivers its required level of service before rehabilitation or replacement becomes necessary. In practice, that means managing the gap between an asset’s current condition and the minimum performance threshold your community has defined. The industry term you’ll see in AWWA guidance and lifecycle-costing frameworks is useful life, which is distinct from physical life: an asset can still be standing long after it stops being worth maintaining. Here are three actions you can take before the next budget cycle:
- Document current Levels of Service (LOS) and condition for your highest-value asset classes, using condition rating scales your council and auditors can verify.
- Identify high-risk, high-criticality assets where failure would cascade across connected systems, not just the individual component.
- Plan one priority surface-preparation and protective-coating intervention for the next budget cycle, targeting the asset closest to its deterioration inflection point.
Table of Contents
- What does municipal asset longevity actually mean?
- How does the asset lifecycle shape longevity decisions?
- Which metrics actually tell you how long an asset will last?
- What strategies extend municipal infrastructure lifespan most effectively?
- How do CMMS, EAM, and inspection tools support longevity planning?
- How do you build a financial case for longevity investments?
- What barriers do municipalities face, and how do you get past them?
- Real-world examples of lifecycle decisions that extended asset life
- How do you build an intervention plan with clear decision triggers?
- Key Takeaways
- Why contractor expertise changes the longevity equation
- How Southernsandblastingandpainting fits into your longevity program
- Useful sources for further reading
What does municipal asset longevity actually mean?
The terminology matters because it drives valuation, replacement scheduling, and budget justification. AWWA’s asset management definitions distinguish five terms that practitioners often collapse into one:
- Design life: The period the asset was engineered to perform under specified conditions.
- Physical life: How long the asset can physically exist before structural failure, regardless of service quality.
- Useful life: The period during which the asset delivers required service at an acceptable cost. This is the number that drives replacement decisions.
- Service life: The actual elapsed time the asset has been in service, which may be shorter or longer than design life depending on maintenance history.
- Remaining useful life (RUL): The estimated time left before the asset falls below its LOS threshold or becomes uneconomical to maintain.
RUL is the most operationally useful of these. It tells you when to act, not just whether an asset is old.
Levels of Service connect directly to longevity decisions. LOS defines what “acceptable performance” means for a given asset class: response time for a pump station, structural rating for a bridge deck, turbidity limits for a water main. When you lower an LOS threshold, you effectively extend useful life on paper. When you raise it, you shorten it. That trade-off changes lifecycle costs significantly, which is why lifecycle costing frameworks require mapping LOS choices against a 10–25 year financial planning horizon.
Municipal assets span four broad categories: linear assets (roads, pipelines, stormwater mains), vertical assets (buildings, water towers, bridges), buried assets (sewer mains, conduit), and natural assets (wetlands, urban tree canopy). Buried and linear assets typically require component-level RUL tracking because their deterioration is invisible until failure.
Pro Tip: Define LOS thresholds in both technical terms (e.g., PACER condition score below 60) and community terms (e.g., “road surface causes vehicle damage”) so that condition triggers are defensible to councils, auditors, and the public simultaneously.
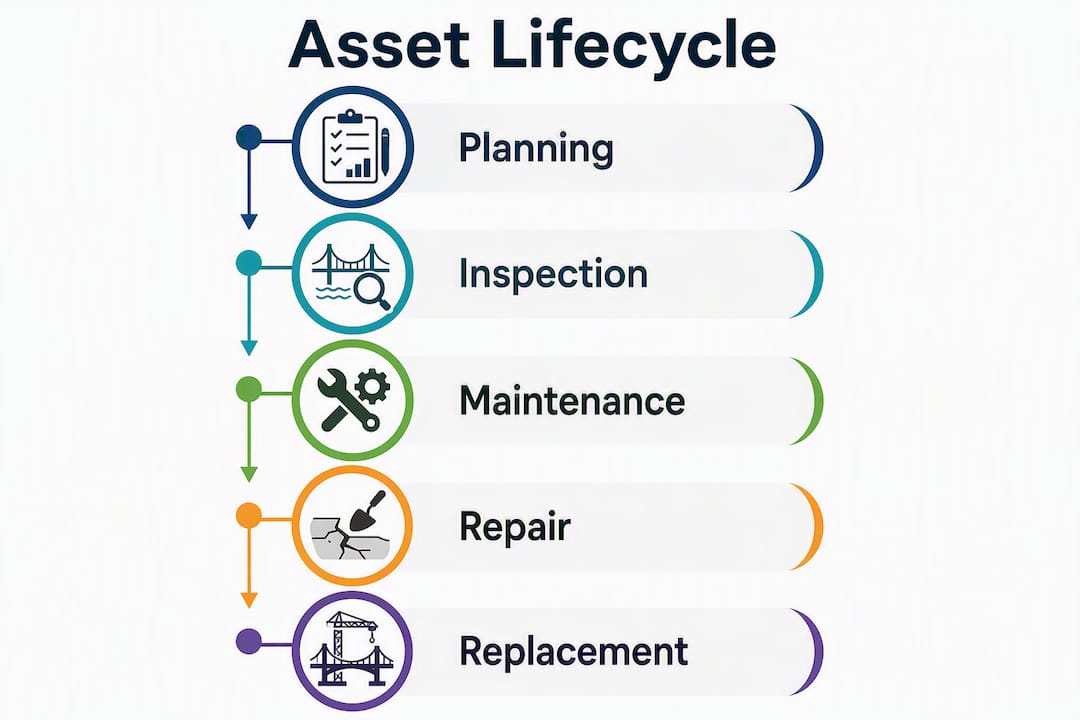
How does the asset lifecycle shape longevity decisions?
Every stage of an asset’s life creates or destroys longevity. The reactive gap, the period when deferred maintenance accelerates deterioration exponentially, is almost always traceable to a decision made at an earlier stage.
- Planning and design: Material selection, design life targets, and LOS specifications set the ceiling for longevity. Specifying a higher-grade coating system or corrosion-resistant alloy here costs a fraction of what it costs to retrofit later.
- Procurement and construction: Quality of surface preparation during initial construction is the single biggest predictor of flowable fill backfill performance over the asset’s life. Acceptance criteria written into contracts at this stage prevent shortcuts that compress useful life by years.
- Operations and maintenance (O&M): This is where longevity is either preserved or eroded. Systematic inventory tracking and scheduled inspections at strategic intervals keep assets on the stable plateau of their deterioration curve rather than letting them slide into rapid decline.
- Renewal and rehabilitation: The inflection point. Intervening here with targeted surface preparation, protective coatings, or component replacement is far less expensive than waiting for failure. Research on preventative restoration confirms that rust removal, concrete cleaning, and protective coatings at this stage stop the rapid condition decline that follows the stable plateau phase.
- Disposal: End-of-life decisions should feed data back into planning for replacement assets. Actual service life versus design life, failure modes, and maintenance cost history are all inputs that improve RUL estimates for the next generation of assets.
A practical checklist for each stage: verify design-life specifications and coating system selection at planning; require surface-prep acceptance criteria in procurement contracts; schedule component-level inspections during O&M; update RUL estimates after every significant intervention; and capture disposal data in your asset management system.
Which metrics actually tell you how long an asset will last?
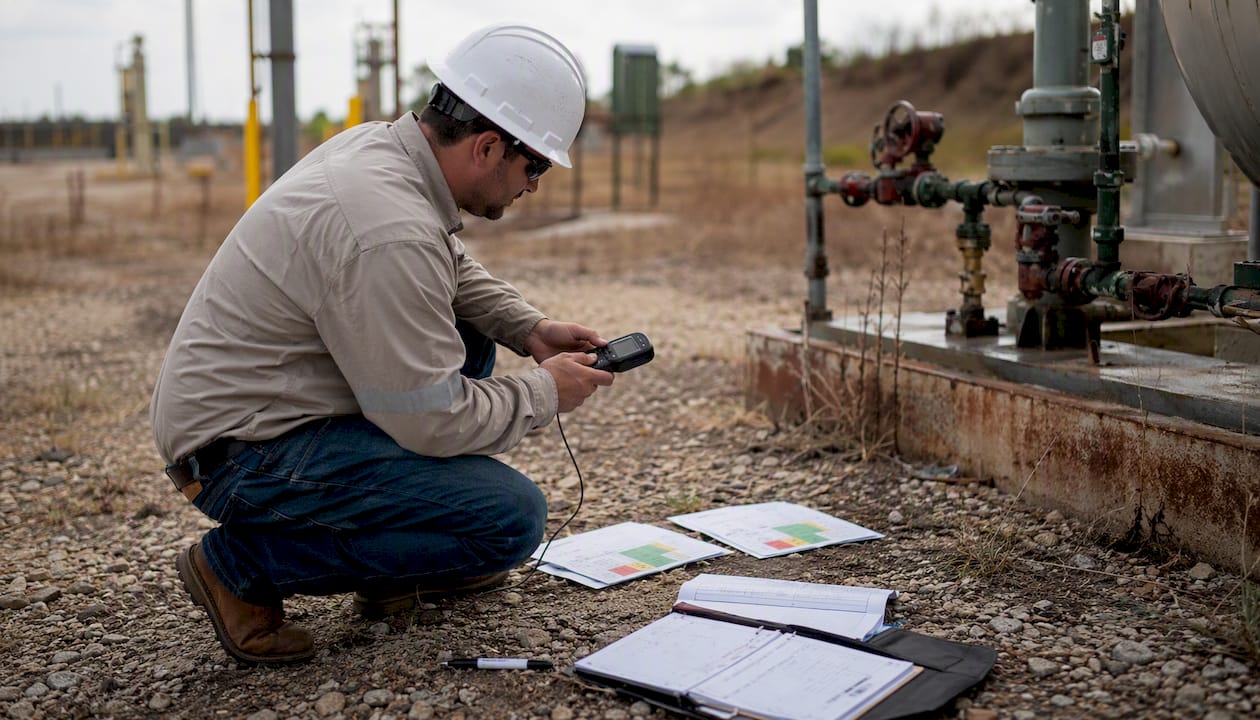
Condition ratings and RUL estimates are only as good as the data behind them. The table below maps the core metrics to their assessment methods and the decisions they inform.
| Metric | Assessment Method | Decision Use |
|---|---|---|
| Condition rating (A–F scale) | Visual inspection, photolog, NDT testing | Trigger for rehabilitation or replacement |
| Remaining useful life (RUL) | Deterioration curve modeling, component-level inspection history | Budget timing, renewal scheduling |
| Criticality score | Consequence-of-failure × probability-of-failure matrix | Prioritization of inspection and intervention spend |
| Failure probability | Historical failure data, age-adjusted deterioration models | Risk scoring for capital planning |
| Mean time between failures (MTBF) | Maintenance records, work order history | Preventive maintenance interval setting |
| Effective annualized cost (EAC) | Total lifecycle cost ÷ remaining useful life | Rehabilitation vs. replacement trade-off |
| Depreciated replacement cost (DRC) | Current replacement cost × remaining life fraction | Financial reporting, funding gap calculation |
Criticality scoring deserves particular attention. An asset with a moderate condition rating but high consequence of failure (a pump station serving a hospital, for example) should rank above a lower-condition asset with minimal downstream impact. Mixing condition and criticality into a single risk score is standard practice in asset management frameworks used by FHWA and APWA.
Component-level data is what makes RUL estimates reliable. Tracking a bridge deck as a single asset tells you it’s 40 years old. Tracking its wearing surface, expansion joints, and bearing pads separately tells you which component will fail first and when.
Pro Tip: Set a minimum inspection cadence tied to criticality: annual photologs and condition scores for high-criticality assets, biennial for medium, and condition-triggered for low. Timestamp every inspection record at the component level so deterioration curves reflect actual elapsed time between interventions, not just asset age.
What strategies extend municipal infrastructure lifespan most effectively?
The order matters here. Spending on the right intervention at the wrong time wastes money; spending on the wrong intervention at the right time does the same.
-
Set LOS thresholds and adopt lifecycle costing first. Without defined LOS triggers, every intervention decision becomes political rather than technical. Lifecycle costing shows that operating and maintenance costs routinely dwarf initial construction costs over an asset’s life, which means optimizing total cost of ownership, not minimizing annual spend, is the correct objective.
-
Invest in high-quality surface preparation and protective coatings at strategic intervention points. This is the highest-leverage physical intervention available for metal, concrete, and infrastructure assets. Modern analytics confirm that earlier, targeted coatings work acts as a hedge against future asset loss. The specification language matters: require SSPC SP-6 (commercial blast) as a minimum for structural steel in moderate exposure, SP-10 (near-white blast) for immersion or severe environments, and document surface profile measurements before coating application. For reliable surface prep on municipal infrastructure, the substrate condition at the time of coating application determines how long that coating performs.
-
Implement preventive and condition-based maintenance programs. Preventive maintenance keeps assets on the stable plateau of their deterioration curve. Condition-based maintenance adds a trigger layer: instead of fixed intervals, inspections and interventions are scheduled when condition data indicates the asset is approaching its LOS threshold. The combination reduces both over-maintenance (spending money before it’s needed) and under-maintenance (missing the intervention window).
-
Account for environmental and climate stressors in materials selection. Coastal assets face chloride-induced corrosion; assets in freeze-thaw climates need flexible coating systems that won’t crack under thermal cycling; high-UV environments in the Southeast require UV-stable topcoats. Long-term financial plans need periodic updates to reflect changing climate exposure and its effect on RUL. Specifying a coating system without accounting for local exposure is one of the most common ways municipalities lose years of service life on an otherwise sound asset.
-
Apply risk management to prioritize the intervention queue. Not every asset can be rehabilitated in the same budget cycle. A risk matrix that combines condition rating with criticality score gives you a defensible, auditable basis for sequencing work and communicating trade-offs to elected officials.
Pro Tip: When specifying protective coatings for a municipal contract, require a holiday test (ASTM D5162 for thin films, NACE SP0188 for immersion service) as an acceptance criterion. A coating that passes visual inspection but fails a holiday test will fail in service within two to three years, negating the entire investment.
How do CMMS, EAM, and inspection tools support longevity planning?

Technology doesn’t extend asset life on its own. It extends your ability to make good decisions about when and where to intervene.
Tool categories and what they contribute:
- CMMS (Computerized Maintenance Management Systems): Work order history, preventive maintenance scheduling, labor and parts cost tracking. The primary source of MTBF data and intervention cost records.
- EAM (Enterprise Asset Management): Adds financial management, depreciation tracking, and lifecycle costing to CMMS capabilities. Connects asset condition to budget planning.
- GIS integration: Maps asset location, age, and condition spatially so you can identify geographic clusters of aging infrastructure and plan interventions by corridor rather than by individual asset.
- Mobile inspection apps: Enable field staff to capture condition ratings, photologs, and GPS-tagged component data in real time. The quality of RUL estimates depends directly on the quality of inspection data.
- IoT sensors and remote monitoring: Continuous condition data for high-criticality assets (pump stations, water mains, structural sensors on bridges). Reduces inspection frequency while improving detection of early-stage deterioration.
Software selection checklist for longevity outcomes:
- Does the system support component-level asset records, not just asset-level records?
- Can it model RUL based on condition history and deterioration curves?
- Does it generate lifecycle cost reports that finance staff and council can read without translation?
- Does it integrate with GIS for spatial analysis?
- Can field staff capture inspection data offline and sync when connected?
- Does it support configurable condition rating scales that match your LOS definitions?
Pro Tip: Start with a critical-asset pilot: pick your five highest-criticality assets, map the full inspection-to-work-order-to-cost workflow in the new system, and validate that RUL estimates from the system match your engineers’ judgment before scaling to the full inventory. A failed rollout on 500 assets is far more disruptive than a learning curve on five.
How do you build a financial case for longevity investments?
The funding gap is real in almost every U.S. municipality: the difference between what it costs to maintain assets at defined LOS and what the annual budget actually allocates. Lifecycle costing is the tool that makes that gap visible and defensible.
-
Collect condition and cost history at the component level. You need actual intervention costs (labor, materials, contractor fees) tied to specific assets and dates, not just maintenance budget totals.
-
Model scenarios. Compare at least three: do-nothing (deferred maintenance), preventive intervention at the current condition rating, and emergency replacement at failure. The cost difference between the first and second scenario is your ROI case for the intervention.
-
Calculate EAC for each scenario. Effective annualized cost spreads total lifecycle cost over remaining useful life, putting a $200,000 rehabilitation and a $900,000 replacement on the same per-year basis for comparison.
-
Present LOS trade-offs explicitly. If the budget doesn’t support full preventive maintenance, show council exactly which LOS threshold drops and what the community consequence is. That framing shifts the conversation from “maintenance costs money” to “deferred maintenance has a price.”
-
Document intervention outcomes. After each rehabilitation or coating project, record the actual cost and the post-intervention condition rating. Over time, this builds a local dataset of ROI multipliers that makes future budget requests far more credible than industry averages alone.
Lifecycle costing is not about minimizing annual spend. It’s about optimizing total cost of ownership, even when that requires higher upfront investment in surface preparation or higher-grade materials. A coating system that costs 30% more but lasts twice as long is the correct choice under lifecycle-costing logic, even if it loses the lowest-bid comparison.
- Use depreciated replacement cost (DRC) for financial reporting: current replacement cost multiplied by the remaining life fraction gives you the asset’s current value for balance sheet purposes.
- Build reserve policies that accumulate funds for renewal over the asset’s useful life rather than funding replacement from a single-year capital budget.
- Update financial plans every three to five years to reflect actual deterioration rates and revised RUL estimates.
Pro Tip: Record every intervention at the project level with a unique asset-component identifier. When you need to justify a coating budget in five years, you’ll have local data showing cost per year of life extension for your specific asset types, which is far more persuasive to a budget committee than a national benchmark.
What barriers do municipalities face, and how do you get past them?
- Incomplete asset inventories: You can’t manage what you haven’t counted. Start with a condition assessment of your highest-replacement-value assets and build outward. A partial inventory with good data beats a complete inventory with none.
- Lack of condition data: Many municipalities have age records but no condition records. Implement a minimum viable inspection program: visual condition ratings on a standardized scale, photographed and timestamped, for every asset class above a defined replacement value threshold.
- Short-term budget cycles: Annual budgeting works against 20-year lifecycle plans. Reserve funds and multi-year capital improvement programs (CIPs) are the structural fix. Present lifecycle cost scenarios to council annually so the long-term picture stays visible.
- Procurement rules that favor lowest bid: Lowest-bid procurement consistently selects the shortest-life solution. Counter it with total-cost-of-ownership evaluation criteria written into the RFP, and with performance specifications (surface-prep standards, coating system requirements, warranty terms) that prevent scope reduction after award.
- Workforce knowledge loss: Experienced staff carry institutional knowledge about asset history that isn’t in any system. Knowledge-transfer programs, structured handover documentation, and asset management software that captures decision rationale (not just work orders) reduce the risk when staff retire.
- Climate impacts on RUL: Changing precipitation patterns, increased freeze-thaw cycles, and rising temperatures all affect deterioration rates. System-level resilience planning that treats assets as interconnected networks rather than isolated items is the most effective mitigation.
Red flags that indicate emergency replacement rather than rehabilitation: active structural failure, contamination risk to public health, condition rating at or below the defined failure threshold with no feasible repair path, or a rehabilitation cost that exceeds 70–80% of replacement cost with minimal remaining useful life.
Real-world examples of lifecycle decisions that extended asset life
A municipal water system lifecycle decision
A mid-sized U.S. water utility facing aging cast-iron mains used condition assessment data and deterioration curve modeling to prioritize rehabilitation over wholesale replacement. By targeting mains with high break frequency and moderate-to-low condition ratings (rather than simply replacing the oldest mains), the utility extended the service life of a significant portion of its network while deferring full replacement costs. The key decision was using component-level failure data, not just age, to sequence the work.
A contractor-level coatings intervention
A municipal water storage tank showing early-stage corrosion on interior surfaces was assessed and found to have a condition rating that placed it several years from failure but well past the point where a minimal touch-up would suffice. The intervention: full abrasive blasting to SSPC SP-10 near-white metal, followed by a three-coat epoxy system specified for potable water contact. The surface preparation removed all mill scale, rust, and existing coating failure. Post-application holiday testing confirmed coating integrity before the tank returned to service. The result was a documented extension of the tank’s useful life without replacement, at a fraction of the replacement cost.
Statistic callout: A data-driven optimization model for wastewater pump stations achieved an average cost saving of 12% compared with the utility’s prior maintenance strategy, demonstrating that smarter intervention timing, not just more spending, drives lifecycle savings.
Procurement and specification tips for coatings projects:
- Specify surface-preparation standards by SSPC grade (SP-6, SP-10, SP-5) and require documentation of surface profile measurements (anchor profile depth per ASTM D4417).
- Require coating system submittals before work begins: product data sheets, application instructions, and compatibility confirmation between primer, intermediate, and topcoat.
- Include a holiday test as a mandatory acceptance criterion for immersion and buried-service coatings.
- Require a warranty that covers both material and application workmanship, with a defined inspection protocol at warranty midpoint.
- Request photographic documentation of surface condition before and after blasting, and at each coat application stage.
For a deeper look at how protective coatings extend asset service life, the specification and application details are where most of the longevity gain is either captured or lost.
How do you build an intervention plan with clear decision triggers?
An intervention plan converts condition data into scheduled, budgeted action. Without it, condition assessments produce reports that sit in a drawer.
- Complete or update your asset inventory with component-level records, replacement values, and current condition ratings.
- Set LOS thresholds for each asset class: the minimum acceptable condition rating, the performance metric it maps to, and the community consequence of falling below it.
- Map condition ratings to intervention triggers using a trigger table (see below). Each trigger should specify the recommended intervention, not just a flag.
- Assign budget windows and procurement lead times to each trigger level so that when an asset hits a trigger, the funding and procurement process are already defined.
- Schedule inspections at intervals tied to criticality and current condition: more frequent as assets approach their trigger threshold, less frequent when they’re well within the stable plateau.
- Validate results after each intervention: record post-intervention condition rating, actual cost, and estimated RUL extension. Feed that data back into your deterioration models.
| Condition Rating | Recommended Intervention | Budget Priority | Typical Lead Time |
|---|---|---|---|
| A–F (Excellent) | Routine inspection, preventive cleaning | Low | Ongoing |
| 6–7 (Good) | Preventive maintenance, minor surface treatment | Medium | 6–12 months |
| 4–5 (Fair) | Targeted rehabilitation, surface prep and recoating | High | 12–18 months |
| 2–3 (Poor) | Major rehabilitation or component replacement | Urgent | 6–12 months (expedited) |
| 0–1 (Critical) | Emergency repair or replacement | Immediate | Immediate |
Pro Tip: For surface-preparation and coating contracts, include this language in your procurement documents: “Contractor shall perform surface preparation to SSPC [SP-6/SP-10 as specified], measure and document surface profile per ASTM D4417 Method C, and submit photographic evidence of each stage prior to coating application. Final acceptance requires a holiday test per NACE SP0188 with zero holidays for immersion service.” This language closes the most common warranty dispute before it starts. For a complete application workflow, the industrial coating application steps resource covers QA checkpoints from blasting through topcoat.
Key Takeaways
Municipal asset longevity is preserved through defined LOS thresholds, component-level condition data, lifecycle-cost budgeting, and timed physical interventions, particularly surface preparation and protective coatings, before assets reach their deterioration inflection point.
| Point | Details |
|---|---|
| Define LOS and useful life clearly | Set condition triggers in both technical and community terms so intervention decisions are defensible to councils and auditors. |
| Intervene before the inflection point | Preventive restoration at the fair-condition stage costs a fraction of emergency repair or replacement at the critical stage. |
| Use component-level data | Track RUL at the component level, not the asset level, to get accurate intervention timing and reliable lifecycle cost models. |
| Budget with lifecycle costing | Operating and maintenance costs routinely exceed initial construction costs; optimize total cost of ownership, not annual spend. |
| Southernsandblastingandpainting as a longevity partner | Specialist surface preparation and protective coatings work, specified and executed correctly, is one of the highest-leverage physical interventions available for extending municipal asset service life. |
Why contractor expertise changes the longevity equation
The gap between a well-written asset management plan and actual life extension usually comes down to execution quality at the intervention stage. Municipalities can define LOS, model lifecycle costs, and schedule rehabilitation perfectly, and still lose years of service life if the surface preparation is inadequate or the coating system is misspecified for the exposure environment.
That’s where experienced contractors change the outcome. Joint scoping sessions before a project begins, where the contractor reviews the asset’s condition history, exposure environment, and LOS requirements alongside the municipal engineer, consistently produce better specification decisions than a contractor receiving a finished spec and bidding against it. Shared acceptance criteria, agreed before work starts, eliminate the most common source of warranty disputes. Pilot projects on a single high-criticality asset let both parties validate the workflow before it scales to a full program.
Contractor expertise on surface preparation and coatings is most valuable when it’s integrated into the asset management plan, not called in after the plan is written. A contractor who can read a deterioration curve, understand what SSPC SP-10 means for a specific substrate, and document the work to the standard your auditors require is a different resource than one who shows up with a spray gun and a low bid. The role of coating contractors in asset protection is most effective when procurement criteria reflect that distinction.
How Southernsandblastingandpainting fits into your longevity program
Twenty years of working on water tanks, pipelines, airports, and city infrastructure in Central Florida gives Southernsandblastingandpainting a specific kind of usefulness to municipal asset managers: the ability to assess a substrate, recommend a coating system matched to the exposure environment, execute the surface preparation to a documented standard, and hand over a project package that satisfies your auditors and warranty requirements.

What that looks like in practice: professional abrasive blasting to SSPC specification, industrial-grade coating application with photographic and holiday-test documentation, and a project record you can attach to your asset management system. For municipalities evaluating whether to contract this work or handle it in-house, the sandblasting and painting services page outlines the full scope of what a contracted engagement covers.
A procurement checklist for hiring a surface-preparation and coatings contractor for municipal work:
- Verify safety and compliance records: OSHA 300 logs, insurance certificates, and any public-infrastructure-specific certifications.
- Request references for at least two comparable public infrastructure projects, with contact information for the municipal project manager.
- Confirm surface-preparation equipment capability: does the contractor have the blasting equipment to achieve SP-10 on the substrate you’re specifying?
- Require a warranty covering both materials and workmanship, with defined inspection protocols.
- Ask for sample project documentation packages from completed municipal projects to verify the standard of record-keeping.
Contractor services are one component of a comprehensive longevity program. Evaluate your internal capacity, procurement rules, and budget timing before contracting, and treat the contractor as a technical partner in the scoping phase, not just a vendor at the bid stage. To understand what the surface-prep process delivers for a specific asset type, the surface prep best practices resource is a practical starting point.
Useful sources for further reading
- Duke Nicholas Institute: Built to Endure — Smart guide for U.S. cities on resilient infrastructure planning and system-level longevity thinking.
- American Public Works Association (APWA) — Standards, resources, and professional guidance for public works managers across all asset classes.
- FHWA Asset Management — Federal Highway Administration guidance on transportation asset management, condition assessment, and lifecycle planning for road and bridge assets.
- EPA Water Infrastructure Resources — EPA guidance on asset management for drinking water and wastewater systems, including condition assessment and financial planning tools.


