

City infrastructure maintenance is the planned combination of routine, preventive, and reactive activities that preserves service levels and minimizes total life-cycle cost. If you manage public assets and need to act today, start here: confirm your asset register is current, identify your ten most critical assets, open a one-year prioritized maintenance plan, and schedule your next round of condition inspections. Those four steps are the foundation on which everything else builds.
Same-day actions to assign right now:
- Verify your asset inventory is complete and includes condition ratings, not just asset counts.
- Flag assets with no inspection record in the past 12 months and schedule them first.
- Pull last year’s reactive-to-planned work ratio. If reactive work exceeds 30%, you have a prioritization problem.
- Confirm your maintenance budget is coded correctly for Motor Fuel Tax (MFT) eligibility where applicable.
- Identify one cross-department coordination gap (utilities, public works, parks) and schedule a 30-minute alignment call this week.
Pro Tip: The most common mistake in public works maintenance is treating the asset register as a one-time project. Assign a named owner for register updates and tie it to your annual budget cycle.
Key Takeaways
Effective municipal asset management combines a current asset register, standardized condition inspections, lifecycle costing, and a prioritized works program to deliver the lowest total cost of ownership across a city’s infrastructure portfolio.
| Point | Details |
|---|---|
| Start with the asset register | A current, condition-rated inventory is the foundation; without it, prioritization and lifecycle costing are guesswork. |
| Target 80% planned maintenance | Industry guidance recommends roughly an 80/20 planned-to-reactive ratio for gray assets to minimize life-cycle costs. |
| Use a “mix of fixes” approach | Preserve assets in the preventive window, rehabilitate moderate-condition assets, and replace only those past the economic threshold. |
| Align funding to eligibility rules | MFT, CIP, and federal grants each have specific eligible uses; misclassification causes audit findings and delays. |
| Surface prep determines coating life | Anchor profile, DFT per coat, and adhesion testing are the four QC points that determine whether a coating lasts 5 years or 25. |
| Southernsandblastingandpainting | Specialist sandblasting and protective coating services for municipal assets in Central Florida, with 20+ years of documented project experience. |
Table of Contents
- What does a city infrastructure maintenance guide actually cover?
- How do you build an Asset Management Plan for city infrastructure?
- How should you design an inspection and condition-assessment program?
- What maintenance tasks apply to each major asset class?
- How do you prioritize which infrastructure projects to fund first?
- What funding sources support city infrastructure maintenance?
- How should you staff and procure for maintenance work?
- Which technology tools actually move the needle for maintenance programs?
- What KPIs should you track and report to elected officials?
- How do you prepare for and manage maintenance during emergencies?
- What operational best practices reduce rework and total cost?
- Surface preparation and protective coatings: the technical module every AMP needs
- Why maintenance investment decisions are harder than they look
- When should you hire a specialist for surface prep and protective coatings?
- Sources
What does a city infrastructure maintenance guide actually cover?
The phrase “city infrastructure maintenance guide” is a useful shorthand, but the recognized industry term is municipal asset management (AM), and understanding the distinction matters. Asset management frames maintenance not as a cost center but as a deliberate strategy to deliver defined service levels at the lowest long-term cost. This guide covers both the operational specifics and the strategic framework municipal managers need to run a credible program.
The three maintenance types every program must balance
Routine maintenance is recurring, scheduled work that keeps assets functional: street sweeping, catch basin cleaning, lighting inspections, and park mowing. It is low-cost per event and high-frequency.
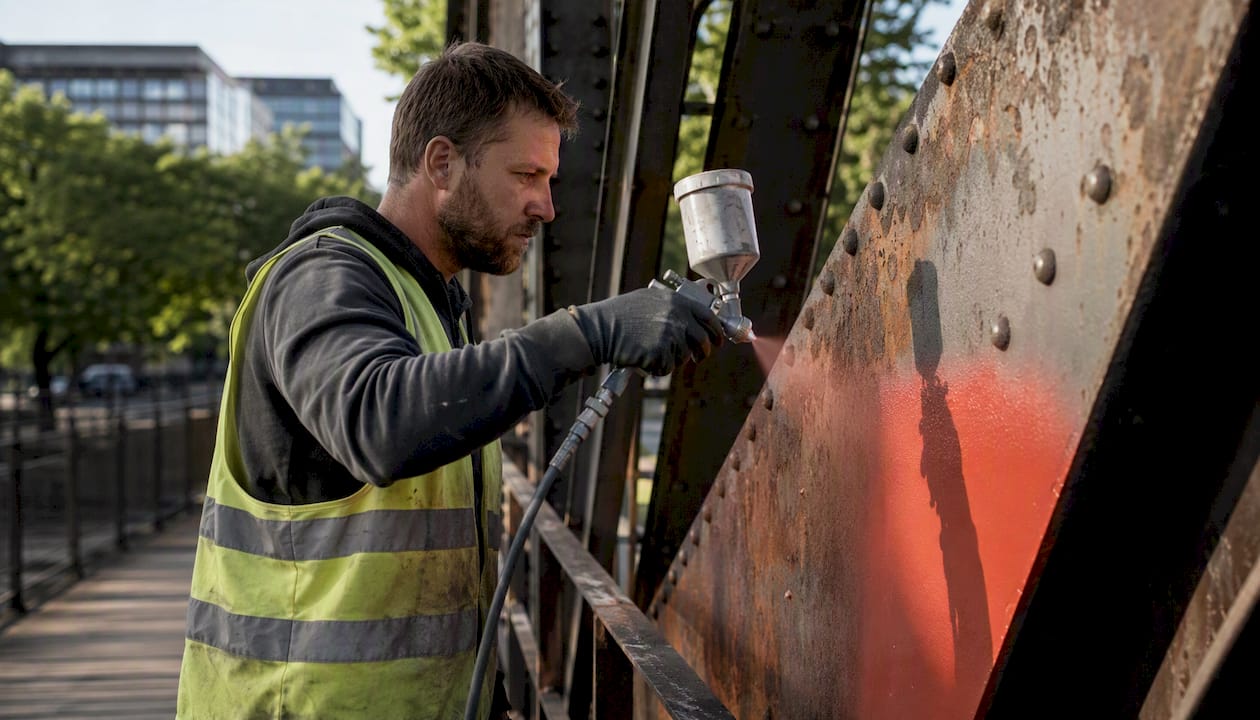
Preventive maintenance is planned intervention before failure: applying protective coatings to a steel bridge, crack-sealing pavement, lubricating mechanical gates, or repainting traffic markings. The goal is to extend service life and defer capital replacement.
Reactive maintenance is unplanned response to failure or safety hazard: pothole patching after a complaint, emergency pipe repair, or storm-damaged sign replacement. Reactive work is almost always more expensive per unit than preventive work, and it crowds out planned activities when it dominates the schedule.
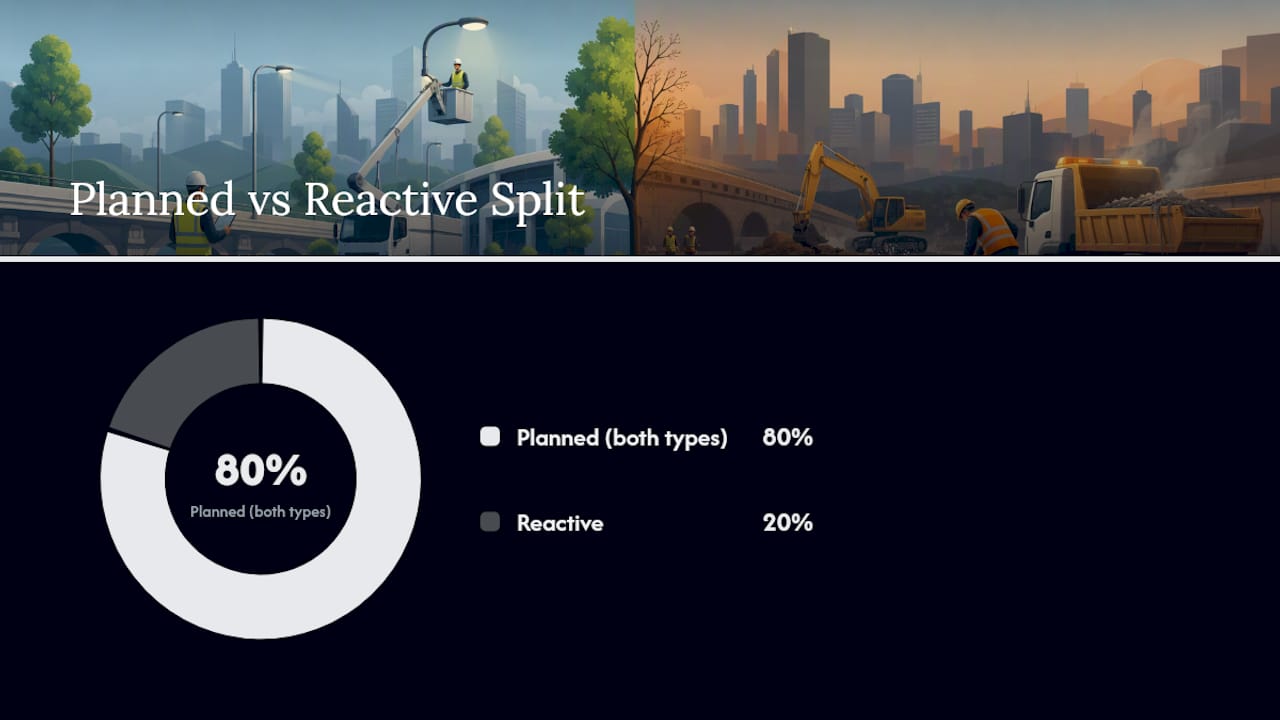
The Asset Management Guide for Local Agencies recommends targeting roughly an 80% planned / 20% reactive split for most gray infrastructure assets. That ratio is not a rigid rule. A high-criticality asset like a water main serving a hospital district warrants a tighter planned ratio; a low-use gravel path can tolerate more reactive response. The point is to make the ratio a conscious policy decision, not a default outcome of underfunding.
| Maintenance Type | Planning Horizon | Typical Resource Intensity | Municipal Example |
|---|---|---|---|
| Routine | Weekly to annual | Low per event, high frequency | Street sweeping, catch basin cleaning |
| Preventive | 1–5 years | Moderate, scheduled | Bridge coating, crack sealing, slurry seal |
| Reactive | Unplanned | High per event, unpredictable | Pothole patching, emergency pipe repair |
Pro Tip: When building your annual work program, schedule preventive tasks in the first half of the fiscal year. Reactive work will fill the second half regardless — leaving preventive work for “later” means it never happens.
How do you build an Asset Management Plan for city infrastructure?
An Asset Management Plan (AMP) is the governing document that connects your inventory, condition data, service-level commitments, and budget into a single decision-making framework. ISO 55000 is the international standard that defines the principles; your AMP is how those principles become operational in your municipality.
Core AMP components
A credible AMP contains six elements. Miss any one and the plan loses its analytical integrity:
- Asset register — a complete inventory with location, age, material, condition rating, and replacement value.
- Condition data — current ratings from standardized inspections, linked to each asset record.
- Level-of-service (LOS) definitions — explicit statements of what performance the community expects (e.g., “no pavement below PCI 40 on arterial roads”).
- Lifecycle costing — total cost of ownership over the asset’s full life, including maintenance, rehabilitation, and replacement.
- Risk assessment — probability and consequence of failure for each asset class.
- Prioritized works list — the output: ranked projects with cost estimates and timing.
The I AM San Diego Strategic Asset Management Plan demonstrates how a large city operationalized this framework. San Diego’s program used a phased rollout across departments, standardized condition-assessment procedures, and an integrated IAM system (built on SAP Plant Maintenance) to connect inspection data directly to maintenance triggers. The lesson for smaller municipalities: start with five asset classes, not fifty.
AMP planning horizons
| Horizon | Scope | Key Deliverables |
|---|---|---|
| Immediate (0–1 year) | Confirm register, schedule inspections, assign owners | Updated asset inventory, inspection calendar |
| Short-term (1–5 years) | Preventive programs, CIP alignment, LOS targets | Five-year maintenance plan, budget requests |
| Long-term (10–40 years) | Replacement projections, lifecycle costing | Capital replacement schedule, funding strategy |
Long-range replacement modeling is worth the effort. Shoreview, Minnesota’s Comprehensive Infrastructure Replacement Plan uses 40-year replacement projections to smooth capital needs over time, avoiding the sharp tax spikes that come from deferred replacement hitting all at once.
Lifecycle costing works like this in practice: a bridge deck that costs $200,000 to coat every 15 years costs far less over 60 years than one that is allowed to corrode and requires a $1.2 million structural repair at year 25. The AMP makes that math visible to elected officials and budget committees.
SAP Plant Maintenance and similar IAM platforms feed this process by storing asset records, scheduling preventive work orders automatically, and flagging assets that have crossed condition thresholds. The technology is only as good as the data behind it, which is why the register and inspection program come first.
Pro Tip: Schedule an AMP update every three to five years, or immediately after a major capital event (a flood, a bridge closure, a significant budget cut). An AMP that is more than five years old is no longer a planning tool; it is a historical document.
How should you design an inspection and condition-assessment program?
Inspections are the data engine of your maintenance program. Without consistent, standardized condition data, prioritization becomes guesswork and lifecycle costing becomes fiction.
Inspection types
Visual inspections are the baseline: a trained inspector walks or drives an asset and assigns a condition score. They are low-cost and scalable. Instrumental inspections use sensors, ground-penetrating radar, CCTV cameras (for pipe interiors), or load testing to detect defects invisible to the eye. Continuous monitoring via embedded sensors or remote cameras is appropriate for high-criticality assets like major bridges or water-treatment facilities.
The Pavement Condition Index (PCI) is the standard condition metric for roads and parking areas. It runs from 0 (failed) to 100 (perfect), with bands that trigger specific interventions: a PCI of 70–85 is the ideal window for preventive treatments like slurry seal or crack sealing; below 40, reconstruction typically becomes more cost-effective than rehabilitation.
For bridges, the Federal Highway Administration’s National Bridge Inspection Standards (NBIS) require inspections at least every 24 months, with element-level ratings that feed into the National Bridge Inventory. Stormwater assets (pipes, inlets, detention basins) typically follow a 5-year CCTV inspection cycle, though high-risk segments warrant more frequent review.
Standardized inspection data must flow directly into your CMMS or IAM system. An inspection report that lives in a PDF on someone’s desktop does not trigger a work order. The Global Designing Cities Initiative notes that regular cleaning and semi-permanent repairs are among the highest-impact, lowest-cost maintenance actions available, and those tasks only get scheduled reliably when inspection findings are connected to a work-order system.
| Asset Type | Recommended Inspection Frequency | Condition Index Used |
|---|---|---|
| Arterial pavement | Annual visual, full PCI every 3 years | PCI (0–100) |
| Bridges | Every 24 months (NBIS minimum) | FHWA element ratings |
| Stormwater pipes | CCTV every 5 years, visual annually | NASSCO PACP rating |
| Street lighting | Annual visual, photometric every 5 years | Operational / lux level |
| Sidewalks | Annual visual | Defect score / ADA compliance |
Process for converting inspections to work orders:
- Inspector records condition score and defect notes in the field (mobile app preferred).
- Data uploads to CMMS; assets below threshold trigger automatic work-order draft.
- Maintenance supervisor reviews, assigns crew or contractor, and sets priority.
- Completed work is recorded against the asset record, updating its condition rating.
- Monthly review of open work orders flags items aging past their target response time.
What maintenance tasks apply to each major asset class?
Streets and pavements
Pavement is typically the largest single asset class by replacement value in any U.S. municipality. The NYC DOT Street and Roadway Construction guidance distinguishes resurfacing (adding a new wearing course over an existing base) from reconstruction (full-depth removal and replacement). Resurfacing is appropriate when the base is structurally sound and PCI is in the 40–70 range. Below 40, reconstruction is usually the right call.
Routine tasks: sweeping, crack sealing, pothole patching, drainage clearing. Preventive tasks: slurry seal (typically every 7–10 years on low-traffic roads), microsurfacing, mill-and-overlay. Reconstruction triggers: structural failure, base saturation, PCI below 35 on arterials.
Bundling pavement work with utility repairs (the “one-dig” strategy) avoids cutting new pavement within its warranty period and reduces total disruption. Coordinate with water, sewer, and gas utilities before finalizing any resurfacing schedule.
Bridges
Routine: debris removal, joint cleaning, bearing lubrication. Preventive: deck sealing, expansion joint replacement, protective coating of steel elements. Reactive: spall repair, scour countermeasures after flood events. Expected service life for a concrete bridge deck is 50–75 years with proper maintenance; a steel superstructure with consistent coating maintenance can exceed 100 years.
Drainage and stormwater
Catch basin cleaning is the single highest-leverage routine task for stormwater systems. A blocked inlet during a storm event causes localized flooding that damages pavement, structures, and private property. CCTV inspection of pipes identifies root intrusion, joint separation, and sediment buildup before they become emergency repairs.
Water and sewer
Water main breaks are reactive by definition, but the frequency of breaks is a function of preventive investment. Cathodic protection for metallic mains, regular valve exercising, and hydrant flushing are all preventive tasks with measurable impact on break rates. Sewer systems benefit from regular cleaning and root-control treatments in known problem segments.
Street lighting, sidewalks, and parks
Lighting: lamp replacement on a group-relamping schedule (rather than individual burnout response) cuts labor costs significantly. Sidewalks: ADA compliance drives prioritization; a tripping hazard on a high-pedestrian route is both a safety and liability issue. Parks: turf, irrigation, and playground equipment each have distinct maintenance cycles; playground safety inspections should follow ASTM F1292 and CPSC guidelines.
How do you prioritize which infrastructure projects to fund first?
Prioritization is where asset management becomes political as well as technical. The temptation is to fix the worst asset first. That instinct is understandable but often wrong.
A “worst-first” approach concentrates spending on assets that may already be past cost-effective rehabilitation. The integrated asset management framework recommends a “mix of fixes” instead: preserve assets that are still in the preventive window (high return on investment), rehabilitate those in the moderate-condition range, and replace only those that have crossed the economic threshold. This approach optimizes spend across the portfolio rather than chasing individual failures.
Risk matrix scoring
Score each asset on two dimensions: probability of failure (condition, age, material, loading) and consequence of failure (safety impact, service disruption, repair cost, equity impact). Multiply the two scores to get a risk rating. Assets with high probability AND high consequence get top priority regardless of their absolute condition score.
| Priority Tier | Criteria | Typical Action |
|---|---|---|
| Tier 1 (Immediate) | High failure risk, safety or regulatory trigger | Emergency repair or accelerated project |
| Tier 2 (Planned) | Moderate risk, within preventive window | Scheduled preventive or rehabilitation work |
| Tier 3 (Monitor) | Low risk, good condition | Routine maintenance, re-inspect on schedule |
Bundling and coordination checklist:
- Cross-reference pavement resurfacing schedule against utility capital plans before finalizing.
- Flag any road segment scheduled for resurfacing within 3 years as a “no-cut” zone for utility work.
- Coordinate lighting upgrades with pavement projects to avoid repeated lane closures.
- Align park irrigation replacement with adjacent sidewalk repair to minimize disruption.
Equity is a legitimate prioritization factor. A low-income neighborhood with deteriorated sidewalks and no ADA-compliant curb cuts has a legitimate claim on maintenance dollars ahead of a higher-income area with marginally lower PCI scores. Document equity criteria explicitly in your prioritization framework so decisions are defensible.
Pro Tip: Present your prioritization matrix to elected officials before budget season, not during it. When council members understand the scoring logic, they are far less likely to redirect funds to politically visible but low-priority projects.
What funding sources support city infrastructure maintenance?
Maintenance funding in U.S. municipalities comes from several vehicles, and most programs use a combination. Understanding which costs are eligible under which fund is not administrative detail — it is how you avoid audit findings and keep projects moving.
Motor Fuel Tax (MFT) is one of the most commonly misunderstood funding sources. The IDOT Local Roads and Streets Chapter 14 enumerates eligible maintenance operations, reporting forms, and the distinction between day-labor and contract maintenance for MFT purposes. Municipalities that explicitly define maintenance eligibility avoid audit issues and speed project delivery. MFT funds are generally restricted to road and street maintenance; using them for parks or building maintenance is an eligibility violation.
Capital Improvement Programs (CIP) are the five-year planning documents that connect lifecycle costing to annual budget requests. A well-built CIP shows elected officials the cost of deferral: if a $400,000 bridge deck rehabilitation is pushed three years, the likely cost becomes $900,000 in reconstruction. That comparison is more persuasive than any abstract argument about asset management.
General obligation bonds fund large capital replacements that exceed annual operating budgets. They carry debt service costs, so they are most appropriate for long-lived assets with clear replacement timelines.
Federal grants (FHWA Surface Transportation Block Grant, CDBG, EPA Clean Water State Revolving Fund) require matching funds and compliance documentation, but they can significantly extend a municipality’s maintenance capacity.
| Funding Source | Eligible Uses | Key Compliance Requirement |
|---|---|---|
| Motor Fuel Tax (MFT) | Road/street maintenance, day labor or contract | MFT reporting forms, maintenance resolution |
| CIP / General Fund | All asset classes, capital and maintenance | Annual budget adoption, CIP update |
| General Obligation Bonds | Capital replacement, major rehabilitation | Voter approval (varies by state) |
| FHWA Surface Transportation Block Grant | Road, bridge, transit | Federal procurement rules, reporting |
| EPA Clean Water SRF | Stormwater, water/sewer | Environmental review, loan repayment |
Smoothing tax and fee impacts over time requires the kind of long-range modeling Shoreview’s infrastructure replacement plan demonstrates: project replacement needs 40 years out, then design annual contributions to a reserve fund that avoids spikes. Elected officials respond better to “we need $200,000 more per year for the next decade” than to “we need $2 million next year.”
How should you staff and procure for maintenance work?
Day labor versus contract delivery
Day labor (in-house crews) offers direct control, faster response for routine and emergency work, and lower overhead for high-frequency tasks. Contract delivery is more cost-effective for specialized work (bridge coating, CCTV inspection, pavement microsurfacing) where equipment and expertise are not justified for in-house investment.
The IDOT Chapter 14 guidance addresses this distinction directly for MFT-funded work: day-labor maintenance requires a maintenance resolution and specific reporting; contract maintenance requires competitive bidding and separate budget coding. Mixing the two without clear documentation creates classification disputes that can delay reimbursement.
Practical procurement separates routine maintenance contracts (rolling scopes, annual renewals) from episodic capital contracts (reconstruction, major rehabilitation). Maintain separate budgets and clear handoffs between the two to avoid fund-eligibility disputes.
Procurement checklist for maintenance contracts
- Define scope clearly: asset class, geographic area, performance standard, and inspection/acceptance criteria.
- Select bidding method: informal quotes for small jobs, formal sealed bids for larger contracts, qualifications-based selection for specialized technical work.
- Require proof of insurance (general liability, workers’ compensation, auto) and bonding where appropriate.
- Include performance measures in the contract: response time, defect rate, warranty period.
- Specify inspection and acceptance criteria so there is no ambiguity about what “complete” means.
- Require safety plans and certifications: OSHA 10 or 30 for supervisors, confined-space entry certification for pipe work, traffic control certification for road crews.
For surface preparation and coating contracts specifically, require SSPC (now AMPP) certification for applicators, specify surface cleanliness standards (SSPC-SP 6, SP 10, or SP 5 depending on exposure), and require dry film thickness measurements at acceptance. These are not optional quality steps; they determine whether a coating system lasts 10 years or 25.
Pro Tip: Build a maintenance bond requirement into coating and surface-prep contracts. A two-year maintenance bond shifts the cost of early coating failure back to the contractor and creates a strong incentive for proper surface preparation.
For project risk assessment on maintenance contracts, document hazard identification and mitigation measures before work begins. This protects the municipality from liability and satisfies OSHA compliance requirements.
Which technology tools actually move the needle for maintenance programs?
The technology stack for municipal maintenance has three tiers: the system of record (CMMS or IAM), the data-collection layer (mobile apps, sensors, GIS), and the analytics layer (dashboards, predictive models). Most municipalities should start with the first tier and build from there.
System capabilities that matter most
- Asset register management: every asset with a unique ID, location, condition rating, and maintenance history.
- Work-order management: create, assign, track, and close work orders tied to specific assets.
- Preventive maintenance scheduling: automatic generation of recurring work orders based on time or condition triggers.
- GIS integration: map-based views of asset location, condition, and work history.
- Condition data ingestion: import inspection results from mobile apps or third-party systems without manual re-entry.
SAP Plant Maintenance is the platform San Diego’s I AM program used to connect condition assessments to automated maintenance triggers. For smaller municipalities, platforms like Cityworks, IBM Maximo, or ESRI’s ArcGIS-based solutions offer similar functionality at different price points. The right choice depends on your existing IT infrastructure and staff capacity, not on feature lists.
Implementation roadmap
- Pilot phase (months 1–6): Select three to five asset classes. Load existing inventory data. Train field staff on mobile inspection apps. Run parallel paper and digital processes to catch data gaps.
- Scale phase (months 7–18): Expand to all asset classes. Integrate with GIS and financial systems. Automate preventive work-order generation for high-priority asset types.
- Optimization phase (year 2+): Add predictive analytics. Build dashboards for executive reporting. Conduct annual data-quality audits.
| System Feature | Operational Benefit | Implementation Priority |
|---|---|---|
| Mobile inspection app | Eliminates paper, speeds data entry | High (Phase 1) |
| GIS integration | Spatial analysis, route optimization | High (Phase 1) |
| Automated PM scheduling | Reduces missed preventive tasks | High (Phase 1) |
| Predictive analytics | Anticipates failures before they occur | Medium (Phase 2+) |
| Public-facing dashboards | Transparency, council reporting | Medium (Phase 2+) |
Workflow for moving inspection data into the CMMS:
- Inspector completes field assessment on mobile app, assigns condition score.
- App syncs to CMMS; assets below threshold generate draft work orders automatically.
- Supervisor reviews queue, assigns priority and crew.
- Crew completes work, records labor and materials in CMMS.
- Asset condition record updates; next inspection date resets.
What KPIs should you track and report to elected officials?
Performance metrics serve two audiences: operations staff who need leading indicators to manage daily work, and elected officials who need lagging indicators to evaluate program outcomes. Build your reporting to serve both.
Operational KPIs (tracked weekly or monthly):
- Percentage of planned vs. reactive work orders (target: 80% planned)
- Average response time to emergency maintenance requests
- Work-order backlog value (total estimated cost of open, unfunded work)
- Percentage of assets inspected on schedule
- Preventive maintenance completion rate (scheduled vs. completed)
Executive KPIs (reported quarterly and annually):
- PCI distribution by road class (percentage of network above PCI 70, 55, 40)
- Bridge condition index distribution (percentage in good, fair, poor condition)
- Maintenance cost per lane-mile for pavement
- Backlog reduction or growth year over year
- Percentage of maintenance budget spent on planned vs. reactive work
The backlog metric deserves special attention. A growing backlog means deferred maintenance is accumulating faster than the program can address it. A shrinking backlog means the program is catching up. Presenting backlog value to elected officials in dollar terms, rather than in asset counts, tends to produce more serious budget conversations.
For public transparency, a simple annual report with a map showing pavement condition by neighborhood, bridge condition ratings, and a plain-language summary of what was accomplished and what remains undone builds public trust more effectively than any press release.
How do you prepare for and manage maintenance during emergencies?
Emergency maintenance is not the opposite of planned maintenance. It is the failure mode of a program that did not plan well enough. That said, emergencies happen regardless of program quality, and the difference between a well-managed response and a chaotic one comes down to preparation.
Immediate emergency response checklist:
- Activate incident command structure and notify department heads.
- Deploy crews for public safety: close hazardous areas, install temporary barriers, post warning signs.
- Document conditions with photos and GPS timestamps before any work begins (critical for FEMA reimbursement).
- Assign a cost-tracking lead to capture all labor, equipment, and material costs by event.
- Notify mutual-aid partners if the event exceeds local capacity.
Temporary repair standards:
Temporary repairs (cold-patch asphalt, temporary sheeting over a failed pipe, sandbag barriers) are not permanent solutions, but they must meet minimum safety standards. Document them as temporary in your CMMS with a follow-up work order for permanent repair. FEMA’s Public Assistance program reimburses emergency protective measures and permanent repairs, but only if costs are documented by event, by asset, and by work category.
Post-event steps:
- Conduct a damage assessment within 48 hours of the event.
- Compile cost documentation by asset and work category for state/FEMA submission.
- Schedule permanent repairs and update asset condition records.
- Debrief response team: what worked, what did not, what pre-positioned materials or mutual-aid agreements would have helped.
- Update the emergency response plan based on lessons learned.
Mutual-aid agreements with neighboring municipalities are worth formalizing before an event. A signed agreement specifying equipment types, crew rates, and reimbursement terms takes weeks to negotiate; doing it during a storm takes days you do not have.
What operational best practices reduce rework and total cost?
The gap between a maintenance program that works and one that merely exists is almost always operational discipline, not budget size.
Seasonal planning is the most underused tool in public works. Pavement crack sealing must happen when temperatures are between 50°F and 80°F and the pavement is dry; scheduling it in July in a humid climate means most of it fails within a year. Bridge coating requires specific temperature and humidity windows. Concrete repair cures poorly below 40°F. Build a seasonal constraint calendar and plan your work program around it, not around fiscal-year deadlines.
Quality assurance on contractor work prevents the most expensive problem in maintenance: paying for work that fails early and requires redoing. Require hold points in contracts where the municipality’s inspector must sign off before the contractor proceeds. For pavement, that means compaction testing before the next lift. For coatings, it means anchor-profile measurement before primer application.
Crew optimization means matching crew size and equipment to the task. Sending a five-person crew with a paving machine to patch three potholes wastes four people’s time. Conversely, under-resourcing a large crack-sealing project means it takes three times as long and ties up traffic control for days. Build standard crew configurations for common task types and use them consistently.
Operational checklist for a well-run maintenance program:
- Preventive maintenance schedules published and assigned at the start of each fiscal year.
- Seasonal work windows identified for temperature-sensitive tasks.
- One-dig coordination meeting held quarterly with utilities and capital projects.
- QA hold points defined in every contractor scope of work.
- Monthly work-order review to catch aging items before they become emergencies.
Pro Tip: *Track your “rework rate” — the percentage of completed jobs that require a return visit within 12 months.
Surface preparation and protective coatings: the technical module every AMP needs
Surface protection is where maintenance strategy meets physical chemistry. A coating system applied to inadequately prepared steel will fail in two to three years regardless of the coating’s rated service life. Applied correctly to a properly prepared surface, the same system can protect a bridge, water tank, or concrete structure for 20 years or more. The role of coatings in longevity is not incidental to asset management; it is one of the highest-leverage interventions available to municipal managers.
Step-by-step surface-preparation workflow
- Pre-blast inspection: document existing coating condition, substrate defects, and contamination (oil, salts, biological growth). Photograph and record baseline condition.
- Surface cleaning: remove loose material, oil, and soluble salts. Power washing or solvent cleaning precedes abrasive blasting.
- Abrasive blasting: achieve the specified cleanliness standard (SSPC-SP 6 Commercial Blast for moderate exposure; SSPC-SP 10 Near-White for immersion or aggressive environments; SSPC-SP 5 White Metal for the most demanding applications).
- Anchor profile verification: measure surface profile with a replica tape (Testex Press-O-Film) or digital profilometer. Profile must fall within the coating manufacturer’s specified range, typically 1.5–4.0 mils for most industrial coatings.
- Primer application: apply within the recoat window specified by the manufacturer. Measure wet film thickness during application and dry film thickness (DFT) after cure.
- Intermediate and topcoat application: repeat DFT measurements per coat. Verify cure before overcoating.
- Final QA inspection: holiday detection on immersion-service coatings, adhesion pull-off testing (ASTM D4541), and total DFT verification against specification.
Coating selection by substrate and exposure
- Steel bridges (atmospheric exposure): zinc-rich primer, epoxy intermediate, polyurethane topcoat. Minimum total DFT typically 10–12 mils.
- Water tanks (immersion service): NSF 61-certified epoxy lining systems. Requires white-metal blast (SSPC-SP 5) and strict DFT control.
- Concrete structures (parking decks, bridge soffits): penetrating silane/siloxane sealer for moisture protection; epoxy or polyurea topcoat where abrasion resistance is needed.
- Coastal or high-humidity environments: specify coatings with proven salt-fog resistance; consider thermal-spray zinc for long-term corrosion protection on steel.
For municipal infrastructure coating, the coating selection decision should be made by a qualified coatings engineer, not by the lowest-bid contractor. The coating system is a 20-year decision; the cost difference between a good system and a marginal one is trivial compared to the cost of premature failure.
QC acceptance criteria
Verified anchor profile, dry film thickness per coat, adhesion test results, and environmental cure checks are the four measurements that materially reduce coating failure risk. Document all four in your QA acceptance criteria before the contractor mobilizes, not after the work is done.
Inspection and QC checklist:
- Anchor profile within manufacturer’s specified range (measured per ASTM D4417).
- DFT per coat within specified range (measured per SSPC-PA 2).
- Adhesion pull-off strength meets minimum (typically 200–400 psi for structural coatings).
- No holidays on immersion-service coatings (tested per NACE SP0188).
- Environmental conditions logged at time of application (temperature, relative humidity, dew point).
- All test results documented in a QA report signed by the inspector.
Why maintenance investment decisions are harder than they look
The political reality of municipal maintenance is that preventive work is invisible. Nobody holds a ribbon-cutting for a bridge coating project. Nobody gets re-elected on the strength of their crack-sealing program. The assets that get funded are the ones that have already failed visibly, which is precisely the wrong time to spend money on them.
Proactive maintenance is almost always more cost-effective than allowing deterioration to force capital replacement. The Asset Management Guide for Local Agencies makes this case with lifecycle data: a dollar spent on preventive maintenance typically avoids four to eight dollars in future capital cost. That ratio is not a marketing claim; it is the consistent finding of municipal asset-management research across asset classes.
The practical implication: your AMP outputs need to be translated into the language of elected officials before budget season. Not condition indices. Not lifecycle cost curves. If we don’t, here is the asset that fails first and what it will cost." That framing works. Abstract arguments about asset management do not.
When should you hire a specialist for surface prep and protective coatings?
Municipal maintenance teams handle a wide range of tasks well. Surface preparation and industrial coatings are not typically among them, and the gap matters. A coating system that fails at year three instead of year twenty is not a minor inconvenience; it is a capital loss and a safety liability.

Southernsandblastingandpainting brings more than 20 years of specialized experience in industrial sandblasting, abrasive blasting, and protective coating application for municipal and government clients across Central Florida. The situations that warrant a specialist call are specific: steel bridges requiring SSPC-SP 10 or SP 5 surface preparation, water tanks needing NSF 61-certified lining systems, concrete structures in coastal or high-humidity environments, and any asset where coating failure carries a safety or regulatory consequence.
What to ask for in a scope of work: pre-blast inspection report with photographic documentation, specified cleanliness and profile standards, DFT requirements per coat, adhesion testing at acceptance, and a QA report delivered at project close. Those deliverables are not optional extras; they are the evidence that the work was done correctly and the basis for any warranty claim.
For municipal procurement in Central Florida, Southernsandblastingandpainting’s sandblasting and painting services and surface prep best practices pages detail the scope, standards, and service area. Request a project consultation to discuss your asset’s specific exposure conditions and coating history before writing a specification.
Sources
- Asset Management Guide for Local Agencies
- IDOT Local Roads and Streets — Chapter 14 (Maintenance – MFT)
- I AM San Diego: Strategic Asset Management Plan
- NYC DOT — Street and Roadway Construction


